Article No. VK-50400
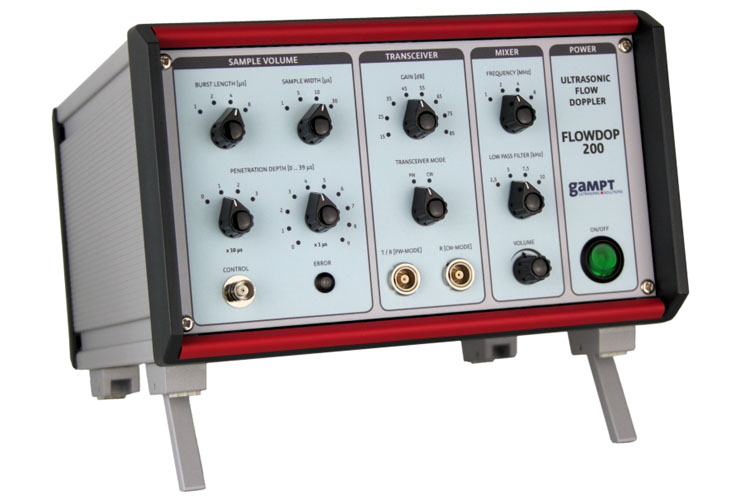
Ultrasonic Doppler FlowDop200
Ultrasonic device for carrying out experiments on the subject of Doppler effect, fluid mechanics and Doppler sonography in vascular diagnostics, Delivery includes manual, power cable, USB cable, software
The ultrasonic Doppler device FlowDop200 generates transmission signals with an adjustable frequency of 1, 2, 4 or 8 MHz, which are transmitted with the connected probe as ultrasonic waves.If these waves are reflected or scattered by moving particles or bubbles, they undergo a frequency shift (Doppler effect). The reflected or scattered ultrasonic waves are recorded and analysed by the device.The measurement signal is also converted into an acoustic signal. The volume of the acoustic signal is here a measure of the amplitude of the recorded signal and its frequency is a measure of the velocity of the scatterers.The measurement signal can be adapted to the respective measuring task by means of the adjustable gain, transmission power and measuring depth. The measurement data can be read out and recorded via a USB interface for detailed analysis on the computer.
Use the adapter VK-10401 to connect an existing probe for the FlowDop (old, discontinued probe).
(Frequency detectin is not possible when using the adapter.)
Transmit frequencies: 1, 2, 4 and 8 MHz
Low pass filter: 2.5, 5.0, 7.5 and 10.0 kHz
Gain: 15-85 dB
Operating modes: PW (CW prepared)
PW-Timing
– Pulse repetition time: 50 µs
– Burst lenght: 1, 2, 4 or 8 µs
– Sample width: 1, 5, 10 or 30 µs
– Penetration depth: 0-39 µs (step size 1 µs)
Acoustic signal with volume control
Interface to the PC: USB
Power supply: 100-240 V, 50 Hz/60 Hz
Dimension: approx. 255 mm × 170 mm × 265 mm (B × H × T)
By means of the FlowView200 software provided, the data measured by the device can be analysed on a computer. The device is connected via a USB interface. During the measurement, the software displays the current Doppler signal. The analysis is carried out by transformation into the frequency domain by means of the Fourier transformation. From the spectrum, the average and maximum frequency shift are determined. The corresponding frequencies and/or the velocities and flow values calculated from them are presented on the screen as values and/or a time curve. In addition, the energy content of the signal is represented.Further analysis functions are the representation of the spectrum with colour-coded intensities over the time range or the investigation of the pulsatility of the flow.
Measuring software FlowDop200 (user interface)