Article No. VK-PHY06
PHY06 Frequency dependence of resolution power
Investigation of the axial resolution power of two ultrasonic probes of different frequency based on two small and closely spaced discontinuities
- Subject matter of the experiment
- Theoretical and practical aspects of the experiment
- Results
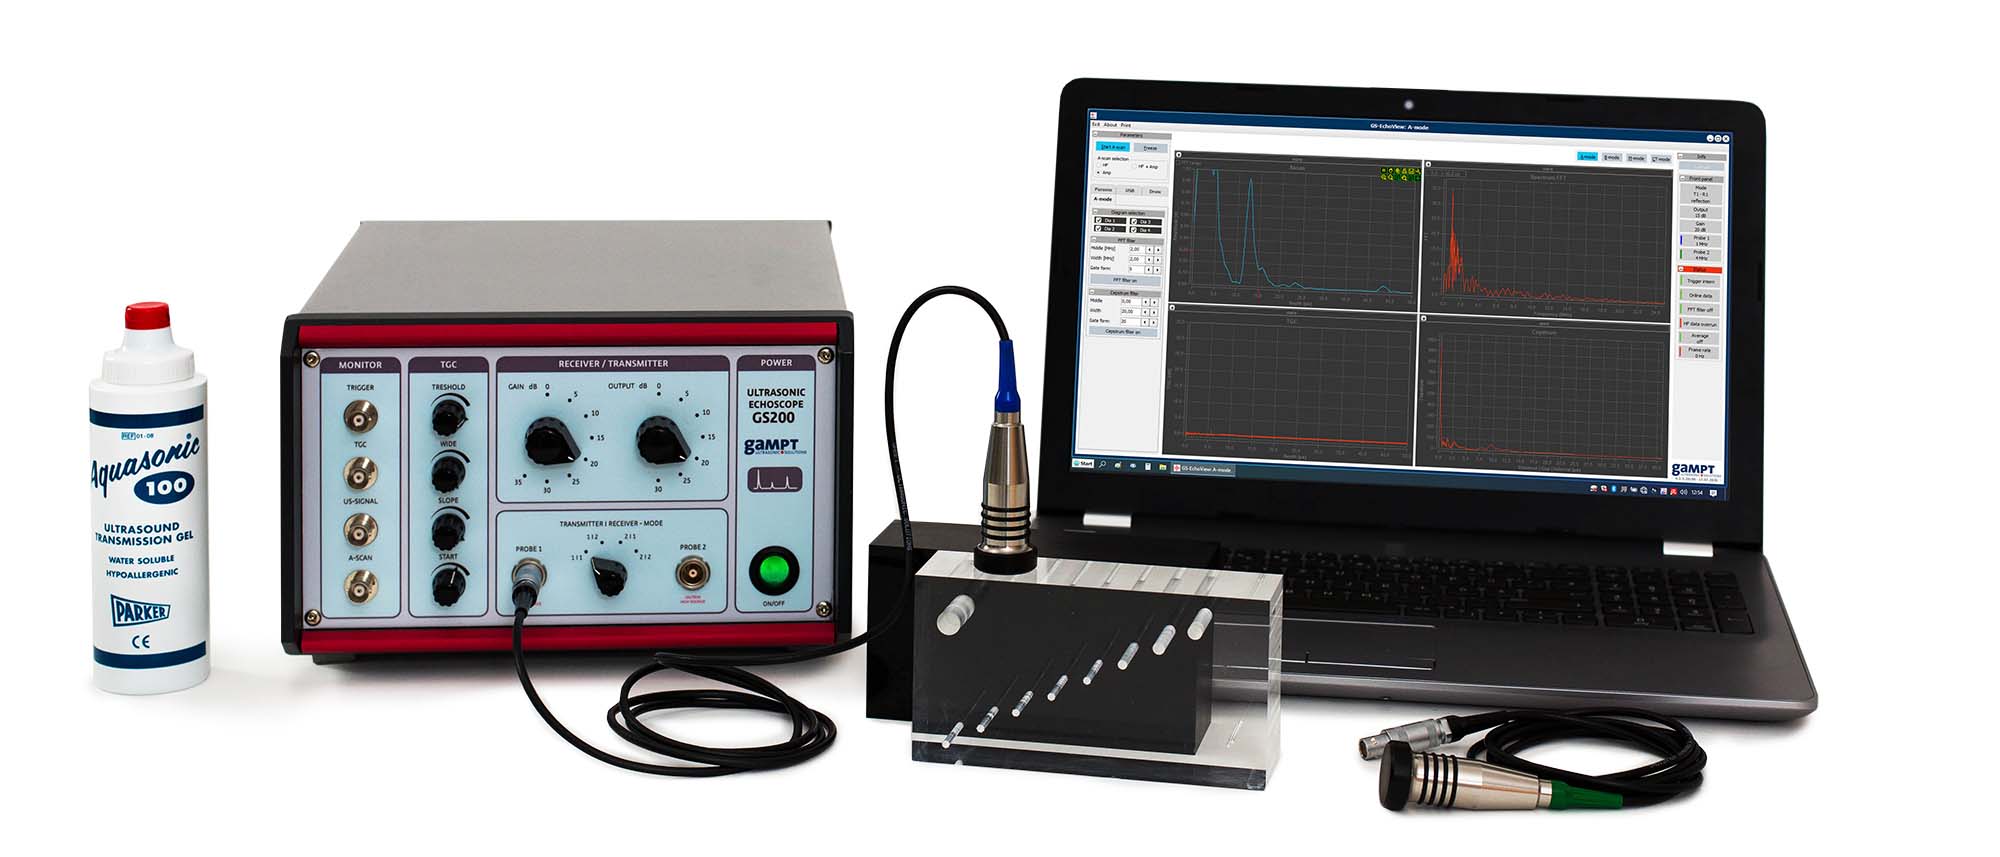
- Equipment
- Related Experiments
Based on two small and closely spaced discontinuities, the axial resolution power of two ultrasonic probes of different frequency is investigated. By analysing the recorded A-Scan images, the connections between wavelength, frequency, pulse length and resolution power are demonstrated.
Keywords: Pulse echo method, amplitude scan, A-Scan presentation, sound frequency, periodic time, wavelength, sound velocity, pulse length, axial and lateral resolution
Investigation methods with ultrasonic systems are based on the exact assigning of the information on a point in the test area to a recorded ultrasonic echo. Because of this, the resolution power of the ultrasonic probes is enormously important. The resolution power can be described as the smallest possible distance between two points the echoes of which can still be separately detected. In the experiment, two neighbouring discontinuities in a test block are to be investigated with a 1 MHz probe and with a 4 MHz probe. The discontinuities are chosen, with regard to size, location and spacing, so that differentiation is only possible with one of the two test probes. In this way, the influence of frequency on the axial resolution power of an ultrasonic probe can be clearly shown.
In the experiment, first of all, a slightly attenuated echo is searched for with each of the two ultrasonic probes and the frequency, wavelength and pulse length determined. After this, the double discontinuity of the test block is investigated. The screen shots of the measurement software show recorded A-Scan images of the double discontinuity (top 1 MHz, bottom 4 MHz). As well as the higher resolution power of the 4 MHz probe, however, the stronger attenuation of the 4 MHz signal is also made clear. In comparison to the 1 MHz probe, the bottom echo with the 4 MHz probe is almost no longer visible.
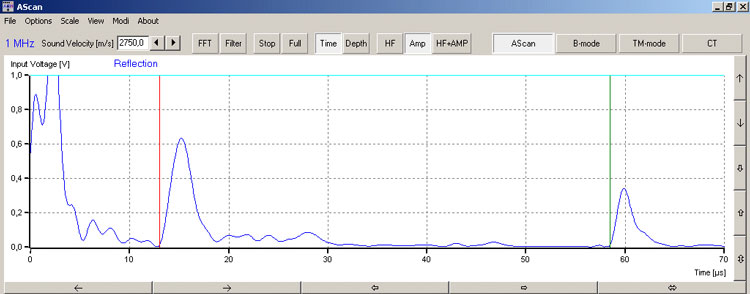
Screenshot showing the echo signal of the double defect of an amplitude scan with the 1 MHz ultrasonic probe
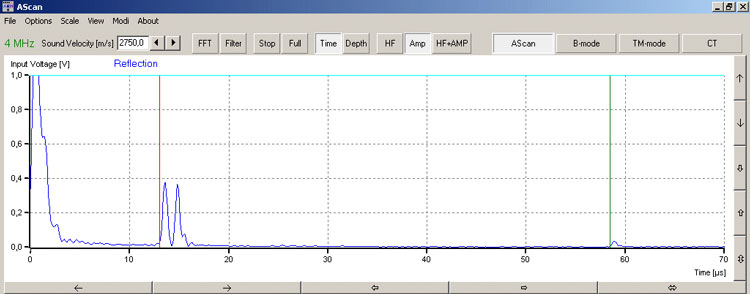
Screenshot showing the amplitude scan of the same double defect as in Figure 3 recorded with the 4 MHz ultrasonic probe
| Ord.no. | Description |
|---|---|
| 10400 | Ultrasonic echoscope GS200 |
| 10151 | Ultrasonic probe 1 MHz |
| 10154 | Ultrasonic probe 4 MHz |
| 10201 | Test block (transparent) |
| 10204 | – optional: Test block (black) |
| 70200 | Ultrasonic gel |