Article No. VK-PHY05
PHY05 Spectral investigations
Demonstration of the difference between the spectrum of a pulse and the spectra of periodic signals using the simple model of multiple reflection at a plate
- Subject matter of the experiment
- Theoretical and practical aspects of the experiment
- Results
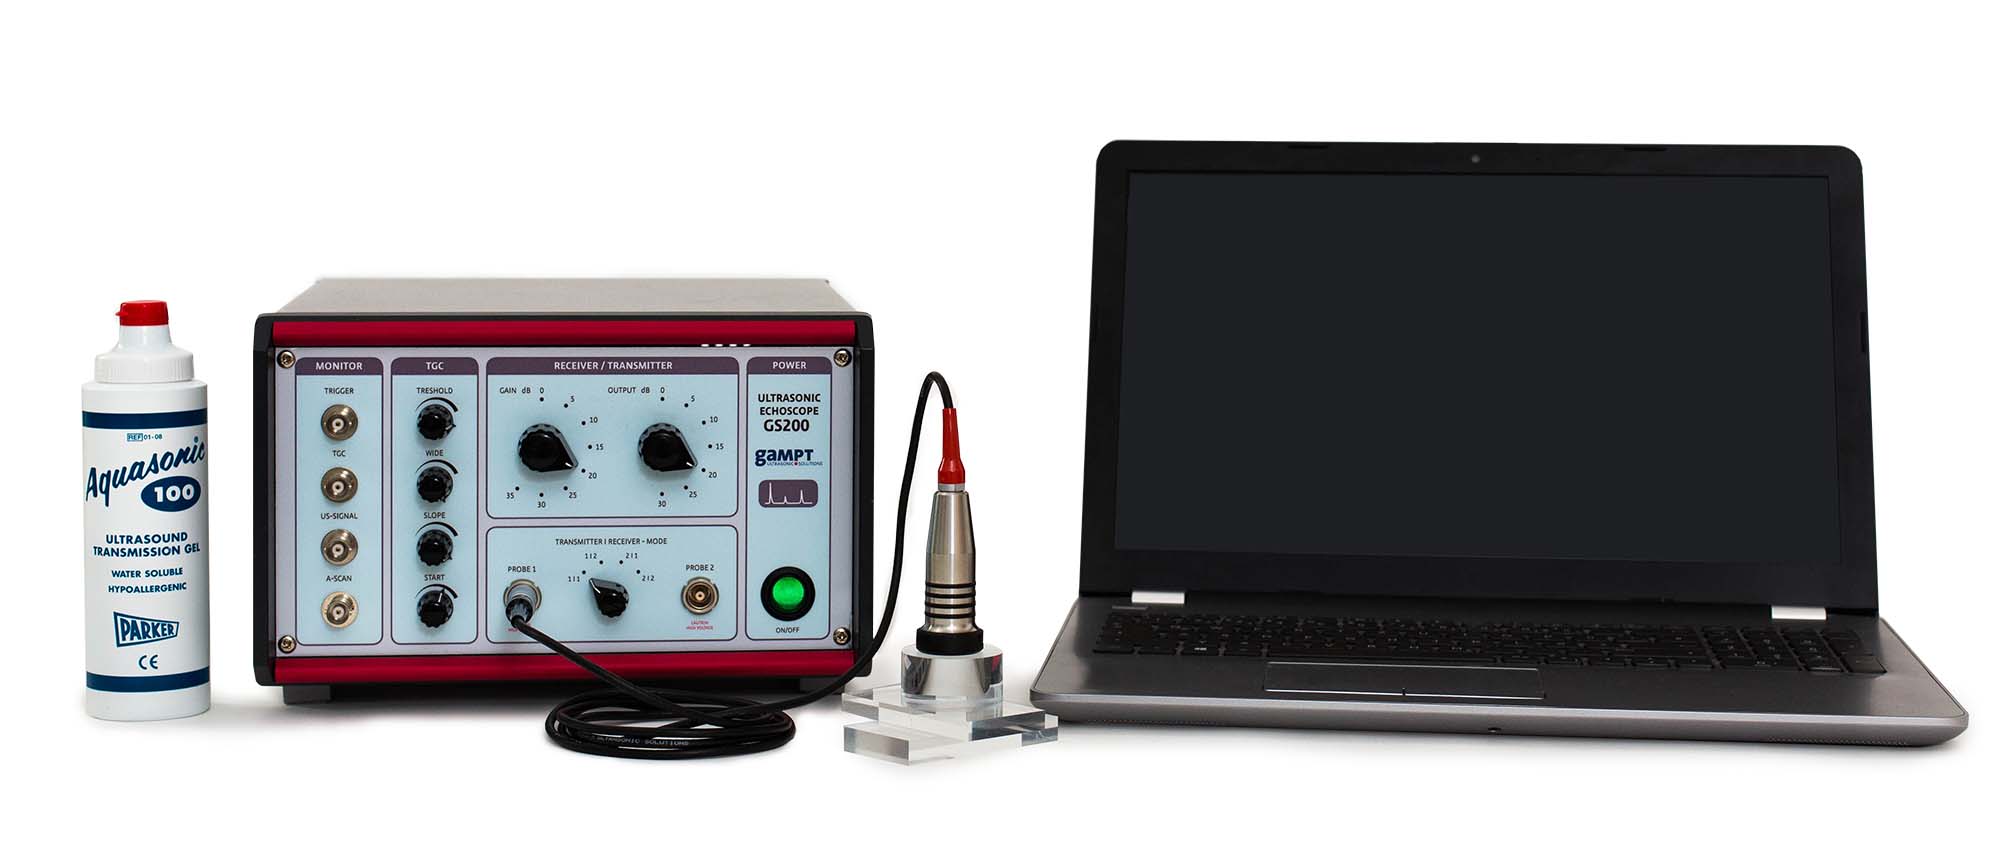
- Equipment
- Related Experiments
Using the simple model of multiple reflection at a plate, the experiment shows the difference between the spectrum of a pulse and the spectra of periodic signals. The cepstrum is derived from the periodic spectrum and in both cases the periodic time is determined in order to calculate the plate thickness.
Keywords: Reflection, transmission, multiple reflection at one or several plates, single pulse, periodic signals, Fourier transformation, frequency spectrum, cepstrum
A time-variable signal such as the signal of an amplitude scan (A-Scan) can be broken down into its frequency components by means of a Fourier transformation (FFT – Fast Fourier Transformation). With this spectrum, small periodic structures can be made visible and characteristics such as layer thicknesses and scattering intervals can be derived. Whereas the Fourier transformation of a pulse only provides that pulse’s basic maximum, the frequency spectrum of a periodic excitation (e.g. via the echo signals of a multiple reflection) shows maximums with equidistant intervals, from which the periodic time of the excitation (time of flight between the reflexes) results. By smoothing the frequency spectrum using the cepstrum method, the equidistant frequency interval can be isolated as a maximum on the time axis of the cepstrum.
The screen shot of the measurement software shows the A-scan image of overlapping multiple reflections at two acrylic plates approx. 7.5 mm and 10 mm thick. Whereas the first echoes at the boundaries delay line/plate 1, plate 1/plate 2 and plate 2/air are still clearly recognisable, clear separation of individual echoes is no longer possible in the further progression of the amplitude signal. This state is reflected in the FFT spectrum via the signal. In the cepstrum, on the other hand, two times of flight (first maxima) can be determined: 5.75 µs and 7.2 µs. With a sound velocity of around 2700 m/s, this yields plate thicknesses of 7.8 mm and 9.8 mm.
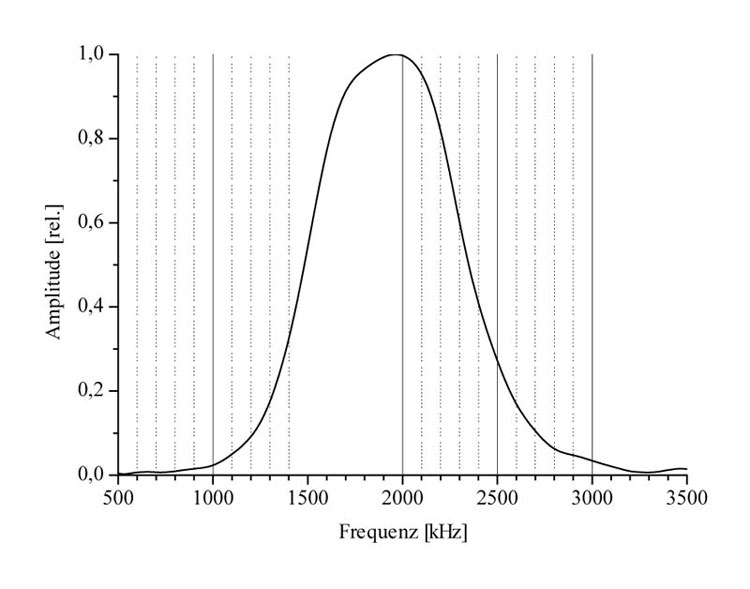
Spectrum of a single pulse
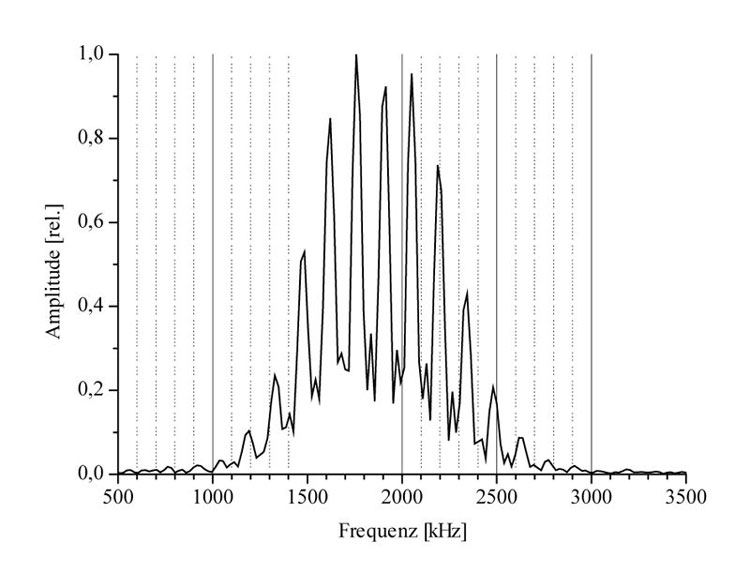
FFT spectrum of a periodic signal (multiple reflexes
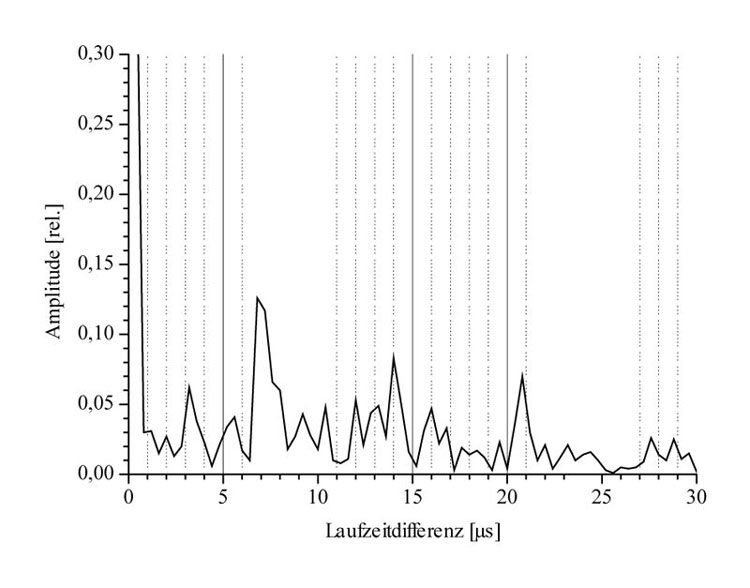
Cepstrum derived from the FFT spectrum
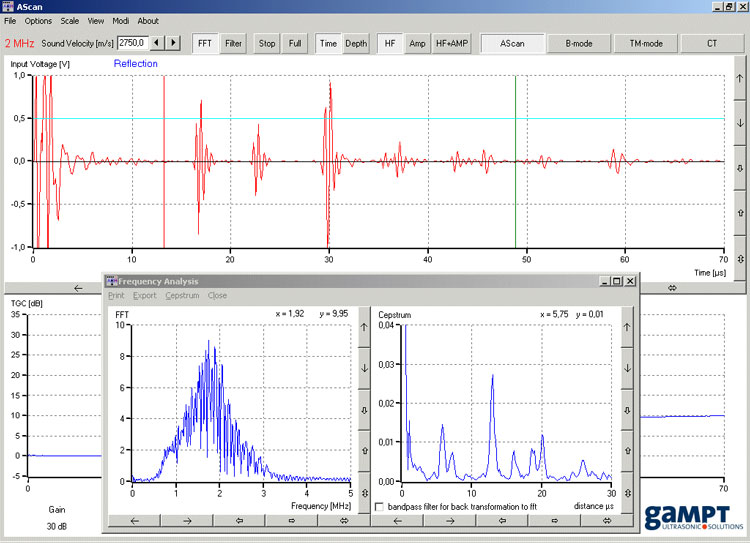
Screenshot of the AScan software showing the program window with the frequency analysis (FFT, cepstrum) of the amplitude scan signal from the main window
| Ord.no. | Description |
|---|---|
| 10400 | Ultrasonic echoscope GS200 |
| 10152 | Ultrasonic probe 2 MHz |
| 10202 | Set of reflecting plates |
| 70200 | Ultrasonic gel |