Article No. VK-MED03
MED03 Basics of Doppler sonography
Acquiring the physical and signal-theoretical basics for blood flow examinations by means of the ultrasonic Doppler effect (Doppler sonography)
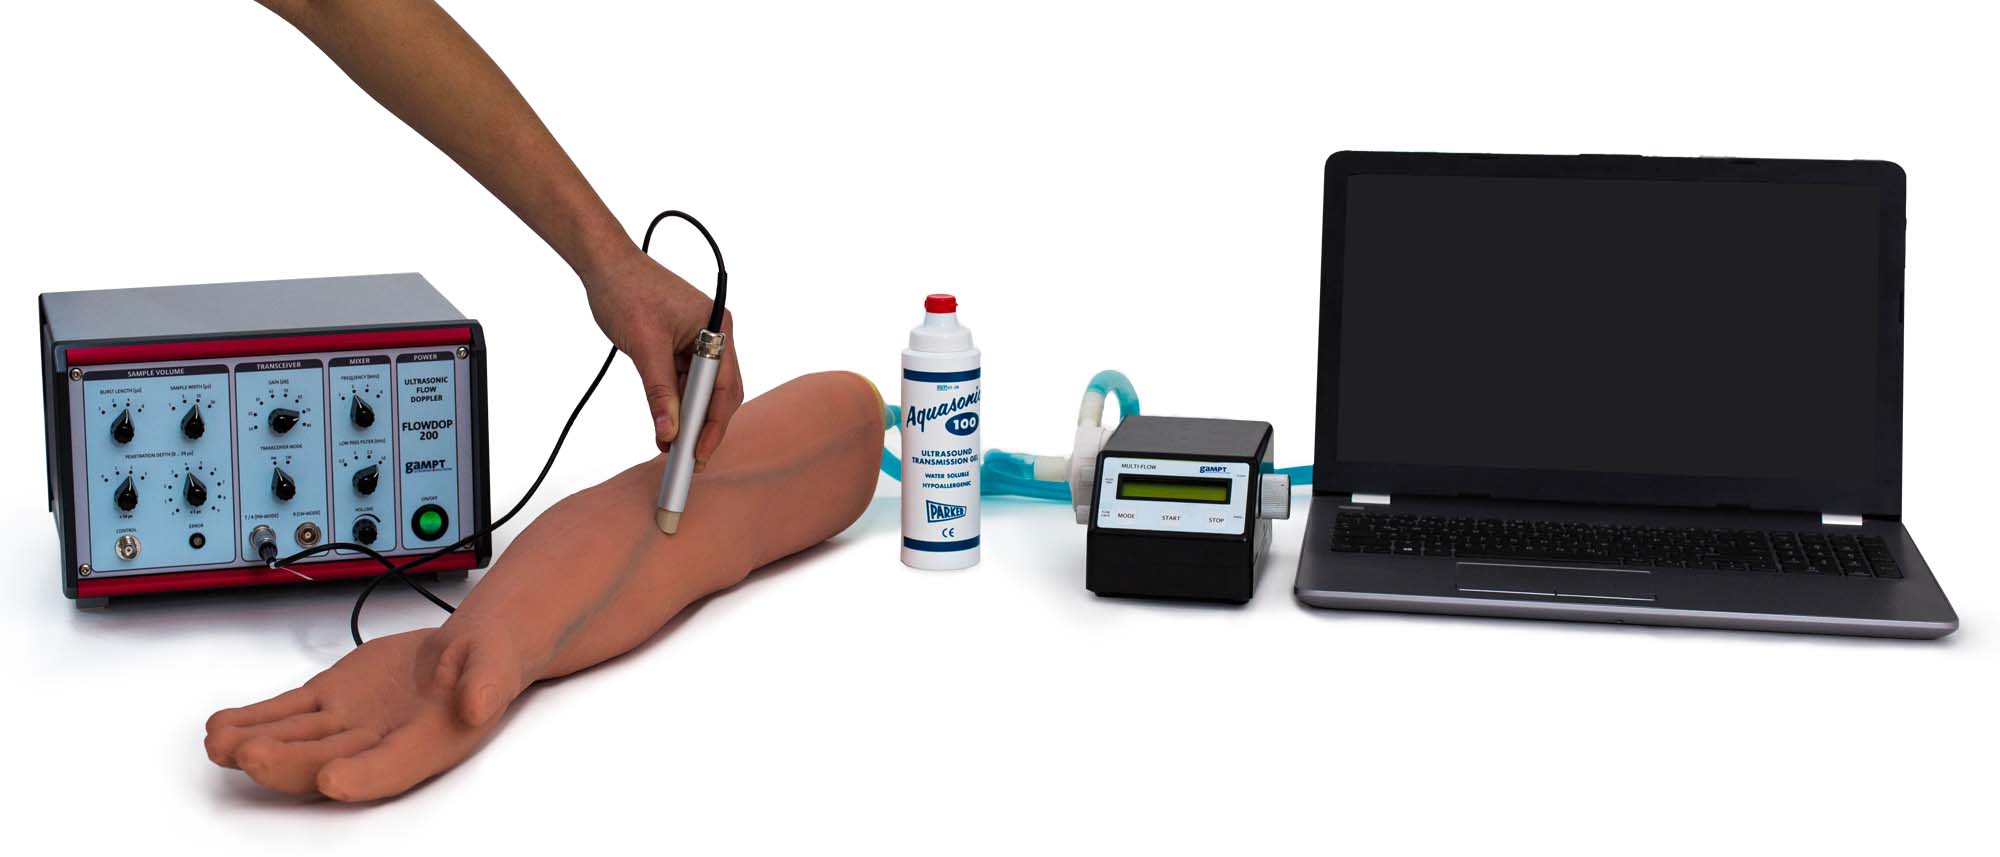
In the experiment, the physical and signal-theoretical basics are acquired that are necessary for blood flow examinations by means of the ultrasonic Doppler method. Using a realistic arm phantom, the dependence of the colour-coded Doppler spectra on signal amplitude, flow velocity, direction of blood flow and choice of the measuring window with the pulse Doppler method are investigated.
Keywords: Ultrasonic scattering, Doppler effect, frequency shift, directional dependence, blood flow velocity, pulse Doppler, cw Doppler, Doppler sonography
In Doppler sonography, the ultrasonic scattering signal of moving particles (here blood cells) is detected and evaluated. Due to the movement of the blood cells in relation to the ultrasonic probe the signal has a frequency shift and can thus be well separated from the signals of the more or less stationary vascular walls and organ boundary surfaces. The frequency shift is here dependent on, among other things, the direction of the blood flow and its velocity. If, in the chronological progression of the measurement (time, x-axis), the scattering intensity (signal amplitude, colour) is presented in dependence on the size of the frequency shift ( velocity, y-axis), one receives the so-called Doppler spectra. These show characteristic changes in dependence on the scattering amplitude (number, size, type of blood particles), flow direction (to the probe, away the probe) and velocity of the scatterers. In addition, with a pulse Doppler, localisation of the vessel is possible by variation of the measuring window.
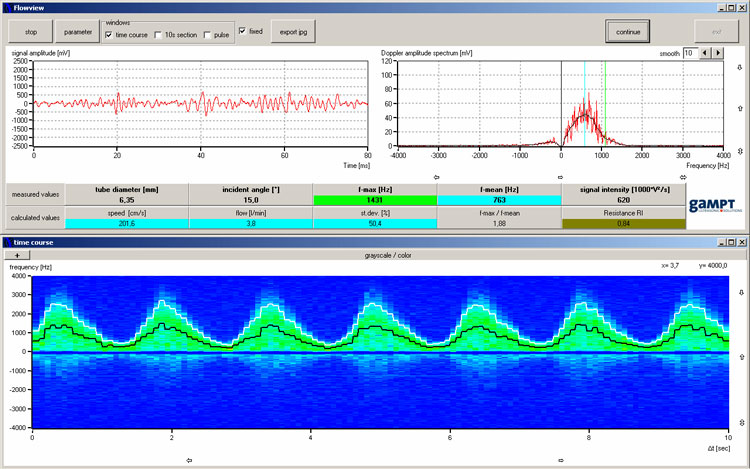
Screenshot of the software FlowView for Doppler measurements
Using the software, the signal processing of the Doppler shift raw signal (top left in figure 3) using the Fourier analysis (top right) to the colour-coded Doppler frequency spectrum (bottom) is shown, and it is possible to carry out the qualitative (pulse shape) and quantitative (average and maximum frequency, signal intensity) analysis of the measurements.
| Ord.no. | Description |
|---|---|
| 50400 | Ultrasonic Doppler FlowDop200 |
| 50130 | Centrifugal pump MultiFlow |
| 50435 | Ultrasonic Doppler probe |
| 50160 | Arm phantom |
| 70200 | Ultrasonic gel |